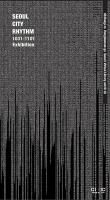
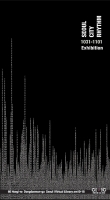
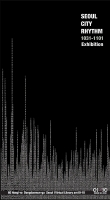
City Rhythm Matrix, Data Visualization + Video, Sound Installation, max8, 2018
Whilst conjuring up various aspects of city life, we asked ourselves what kind of ideas can we express?
Out of our brainstorming came the decision to express people living in the city from a population data approach.
We decided to utilize the newly available “de factopopulation data” as the primary data, provided by the Seoul MetropolitanGovernment. The data is collected on an hourly basis from 19,153 tractscovering the entire Seoul.
The data from a selected week - one that included aholiday - was processed and analyzed. We focused on three specific demographicgroups – the young people in their 20s, the seniors 60 years and older, and thelong-term foreign residents – defined as staying in Korea for more than 90 days.
The noise, the movements, andthe people who cross paths yet do not interact with one another,
Where the 20s congregate, there are hardly any seniors,
And the foreign residentsbarely venture outside their neighborhoods.
We were able to discover that our everyday lives hold many vestiges of data, much more than we expected.
Based on the raw data, we visualized the flow of big data related to the population of Seoul city.
You can feel, even with the merest glance, the weight of the movement.
As you can see, the visualization of the matrix image provided us with the total weight of the population.
The rhythm of the matrix seemed so simple, but it also reminded us of the movement of the people.
Something that comes in waves like the ebb and flow of the ocean.
Noise. Movement. People crossing each other
Seoul is alive, a city bustling with eager people in their twenties. But where are the old people? Hardly any people in their sixties are ever sighted.
Even more, the long-term foreign residents rarely show any movement, as if they are anchored to a specific location.
As you can see on the screen, the numbers, the movements and the dots are all of us. They represent ourselves.
A myriad of data embodies the movements within the city.
The three-dimensional images of the dots seem to take on the form of particles drifting across outer space.
Let’s assume that these dots indicate the movements of the people living in Seoul.
This world of numbers before us has the immense power to draw us into the world of data in a moment, and so transfixed by it, we are left looking into it for quite some time.
Is this because data is the product of a very real phenomenon?
KT의 통신 시그널을 통해 집계되고 서울시에서 공공데이터로 공개한
서울시 ‘생활인구 데이터를 기본 데이터로 활용하여 서울시 19,153개 집계구를 공간적 대상으로, 서울에서 생활하고 있는 인구를 공휴일이 포함된 일주일, 하루 24시간 1시간 단위로 파악했다.
첫 번째 과정으로 데이터에 사용된 로우 데이터, 400여개의 행정동 24시간 7일간 서울시 생활인구의 빅데이터의 흐름을 시각화하기로 했다. 그대로 매트릭스 이미지로 시각화했더니 인구 총량의 무게를 한 눈에 확인할 수 있었다.
총인구의 시공간적 변화를 Visualization을 통해 시청각적으로 직관할 수 있는 방법을 시도했다.
사운드 인스톨레이션, VR로 서울의 리듬을 들여다보았다.
일상의 이동은 어떤 패턴으로 반복되고 있으며, 평일과 공휴일의 이동 패턴은 어떤 차이를 보이는가?
노인들이 청년보다 더 큰 이동성을 갖는다는 결과를 어떻게 해석해야 할까?
현저하게 낮은 외국인들의 이동성과 내국인들과 상반된 그들의 이동방향은 어떠한 사회적 함의를 담고 있는가?
(일은 주로 수도권에서 하는데 서울시 생활인구는 등록인구보다 많다. 이건 등록인구보다 실재 거주 외국인이 훨씬 많다는 이야기로 보였다)
숫자이거나. 움직임이거나 이 수많은 데이터는 결국 도시안의 움직임이다.
행정동 400개 안에서 움직이는 사람들을 어떻게 한 눈에 확인할 수 있을까?
3차원 점 이미지는 우주공간을 떠도는 입자들 같다.
서울에서 생활하는 사람들의 움직임에 대입해보았다.
여기에 구별로 채집한 소리를 입혔다.
이 숫자의 세계는 금방 우리를 데이터의 세계 안으로 끌어들이고
한참을 들여다보게 하는 힘이 있다.
데이터란 실재의 현상이 만들어낸 결과였기 때문이 아닐까.
Credits:
Producer and writer: Park Seoeun
Director: Kim Siyeon
Graphics: Kim Siyeon, Park Jiyoon, Woo Hyeunjoo
Composer: Kim Siyeon
Editor: Kim Siyeon
Voice: Ariane Carmignac
Sound design, mixing: Kim Siyeon
Data: Kim Wooil, Park Hoontae
Engineering help: Kim Hojoong, Jeong Sangchul, Lee Sanghoon
Production: ARTLab
Coordinator: Suh Heesun / K’occa
With the support of Korea Creative Content Agency
ⓒ 2018


